So how does one decide whether cannabis legalization increases violent crime? The naive first approach would be to look at rates of violent crime before and after legalization. If violence increases post legalization, that's at least suggestive. But of course that doesn't tell you anything about causation. Violence crime rates increase and decrease for lots of reasons. If violent crime is increasing in states that legalize, we need a control group to compare them to. We need to establish the counterfactual, as in what would have happened if not for cannabis legalization. Also, as with anything we measure, there is random noise in these statistics. That's not to say we don't know how many murders actually happened in Colorado in a given year. Even supposing we count those accurately and to a body (and I think the counts are quite precise), the process that generates those body counts is random. Many of these violent crimes are crimes of passion. Someone gets angry in the moment and assaults or murders someone; the same person on a slightly better day wouldn't have become a murderer. Someone fires a gun with the intent to kill, but misses their victim. A murderer experiences a delay in their plans when their victim does something unexpected, giving the would-be murderer time to rethink things. So the actual realized crime rate, literally the count of crimes divided by the population, is a somewhat noisy measure of the thing we're really interested in, the underlying propensity of the population to commit violent crime. So we need error bars. We need confidence intervals to tell us if an X% increase in crime rates is something that could come about by random chance or something that indicates that the underlying drivers of crime have actually changed.
There have been some very good studies that find appropriate control groups and compute the confidence intervals, and I'll get to these later. There seems to be some contention about whether those controls are done appropriately. Perhaps the statisticians, who are often accused of being themselves biased in favor of legalizing cannabis, are using statistical magic to make a real effect disappear. No doubt this is a very real problem in some academic disciplines. There are generally many different model specifications to choose from. Just a few nobs to turn and flips to switch on your regression analysis leads to a combinatorial explosion of possible models. It's always possible that the modeler has done a large number of these and cherry-picked the one that gave him the desired result. I think the appropriate way to deal with this is for the statisticians and critics to come together and discuss the various choices in model design, decide which specifications are more plausible or appropriate, settle on a constrained space of model specs, and openly report the sensitivity of the results to various specs.
For the moment, I'll start with crude methods.
The Raw Data
Below I have plots of violent crime rates by state for the states that have legalized cannabis. The data all comes from here. (Simply click on Summary (SRS) Data With Estimates and download the estimated_crimes.csv file. That's what I'm using to build these plots.) There are four kinds of violent crime tracked here: aggravated assault, homicide, rape, and robbery. If Berenson's story is correct, we're probably only interested in aggravated assault and homicide. It's unlikely that paranoid psychosis-induced violence would have an effect on the other categories of violence.
Start with aggravated assault, which is more frequent than murder and thus has a stronger signal, statistically speaking. Notice that I'm color-coding based on the year that cannabis was legalized. Colorado and Washington legalized in 2012. Oregon, Alaska, and DC legalized in 2014. California, Nevada, Massachusettes, and Maine legalized in 2016, and Vermont legalized in 2018. The data is only through 2018, so we only get one post-legalization data point for Vermont. (If the figure is overlapping the stuff on my side-bar, note that you can click directly on the figure to enlarge it for a clearer view.)

It's certainly true that some of these states have seen increases in violence, as measured by this statistic. The post-legalization trends for AK, CO, WA, and OR are up. But DC is down. CA, MA, ME, and NV are down, despite the trend for the nation as a whole (marked "US") being slightly up. California has been declining for two decades, despite having medical marijuana since 1996. Many think that medical legalization in California was de facto legalization, as it was permissible for a doctor to recommend it for almost anything. (I don't fully understand this, but doctors in California could issue "recommendations" that weren't officially "prescriptions", but as long as you secured such a recommendation you could get cannabis from a dispensary.) Other states placed tight constraints on what conditions were acceptable for medical cannabis, so the connection between medical cannabis and rates of recreational use is less clear. Note that Colorado and Washington initially decrease before coming back up. This is not a unambiguous "legalization leads to violence" story. Now let's look at homicide rates.

Let's take a longer view. In the above, I'm purposefully focusing on the year 2000 and later so we can compare post-legalization to recent trends. What if we go all the way back to 1979, where the data begins? Violence was famously much higher in the 80s and 90s. As Stephen Pinker documents in his book Better Angels of Our Nature, violence has been declining for a very long time. Take a look at the recent trends in light of a historical perspective. Here is assault:

And here is homicide.

Other than assault in Alaska, the historical perspective makes the recent trends look puny. Don't get me wrong, it would be horrible if a state's violence rate went back to what it was in the 80s and 90s. I don't want be accused of making the argument: "The effect gets smaller when I rescale my y-axis." But we should try to appreciate the effect of cannabis on crime, whatever its magnitude, in context with other drivers of crime and other policy considerations. It is widely believed that drug prohibition is a major driver of violent crime because of black market violence, and the so-called "crack epidemic" of the 80s and 90s saw high levels violence between rival drug gangs. This was mostly not pharmacologically induced violence. This paper by Jeff Miron suggests that variation in the level drug enforcement explains something like half the variation in the murder rate. Note that's a regression analysis, and statements such as "explains half the variance" are statements about correlation, not causation. But the "causal" story is reinforced by the work of Paul Goldstien, who actually looked at all the murders in New York city from 1984 to1988. He coded them as non-drug related, pharmacologically induced violence, economic crimes to support a drug habit, and black market violence. Violence related to drug commerce was the dominant category. (See the discussion in the Miron paper, which also lists the Goldstein papers in the References.) If that's even close to correct, we should be far more concerned about violence related to drug trafficking than the pharmacologically induced violence that Berenson is warning us about.
Maybe actual use rates post legalization changed more in some states versus others? We don't care about legalization per se unless it drives up cannabis use and leads to these social problems that the critics are worried about. I looked this up, too. It's not exactly well organized, but SAMHSA tracks this by state and publishes reports. They have "past year" and "past month" marijuana use. I'm using past month, because presumably the higher-frequency use is what's going to track with excessive use and thus violence, assuming that causal connection exists. (Here is one year's data. I could not find a file where this was all in one place for all years. Also, some years have this in a pdf, while others had it in an Excel spreadsheet. I had to awkwardly key values from a pdf into my own spreadsheet for those years. Government agencies need to get a lot better about how they disseminate their data!) The SAMHSA reports compute by-state use rates using two years at a time, so, for example, 2016 on my charts is really 2016-2017. I couldn't find anything in the 2004-2008 time period, but one report had the data for "2002-2003". So we at least have one data point from the period well before legalization. Here is what I saw.
 Note that cannabis use trends upward even prior to legalization, but it definitely looks like there is a post-legalization increase. Unfortunately, there just aren't enough post-legalization data points for the states that legalized in 2014 and 2016 (and none yet for VT, which legalized in 2018). Now, one could seize on this and say, "Ah ha! Cannabis use increased more in Colorado, Oregon, and Washington, and those are the states with the clearest pattern of post-legalization increases in violence!" But it also looks like DC and Nevada saw a stark increase in cannabis use, and these jurisdictions bucked the "increasing violence" trend. California saw increasing rates of cannabis use for a decade and a half, but its rates of violent crime were declining over this period. Crudely speaking, this is a period of declining rates of violence and increasing rates of cannabis use.
For comparison, here are some non-legalizing states. It looks like cannabis use rates are increasing in many states that did not legalize. So the increase in the general trend for the US is not simply being driven by legalizing states.

Of course, this is all very crude. Eyeballing graphs and computing raw statistics is dangerous. One is likely to fool oneself and spot patterns that aren't really there. We need a more rigorous analysis that controls for confounders and computes confidence intervals. I'm only showing this because some anti-pot crusaders obsess over the raw data. The statisticians who do a more rigorous analysis are sometimes accused of being biased, using statistical tricks to make the effect disappear. With the above plots, I'm merely trying to show that crude methods, like eyeballing the raw trends, don't tell an unambiguous "more cannabis -> more crime" story.
Studies Using Synthetic Controls
I found two good papers on the cannabis-violence question, both of which use synthetic controls. The idea here is that you find a set of "control" states that behaved like the "treatment" state prior to legalization. Actually, if I'm reading this right, the approach uses a weighted average of all "untreated" states, picking a set of weights that best matches the legalizing state's trends prior to legalization. (One paper uses a subset of non-legalizing states, which it calls "donor states".) Having established these weights, one can compute what the trend for the legalizing state should have been if it hadn't legalized, then compare that to what actually happened. One of these papers discusses legalization of medical cannabis, the other recreational legalization.
The paper on medical cannabis is called Joint Culpability: the Effect of Medical Marijuana Laws on Crime. Here is a link to the full paper. Medical marijuana laws are not the same as laws that fully legalize recreational marijuana, but surely they increase the availability of marijuana. Some states had lax prescribing guidelines, such that you could get a prescription for almost condition. In fact, anti-cannabis fuddy-duddies like to complain that medical cannabis was just a wedge issue designed to make recreational cannabis more acceptable. As described above, many of them complained that California's medical cannabis law was de facto legalization, considering the ease with which one could obtain a doctor's recommendation. Supposing these cannabis critics are correct, legalizing medical marijuana should have led to an increase in recreational use. It seems likely that there would be some leakage from legitimate prescriptions to recreational users. (Based on some personal anecdotes, I know that this happens to some extent.) This paper cites several studies that quantified the effect of medical marijuana on overall use; they suggest the increase is in the 10%-20% range. If our hypothesis is that an increase in recreational marijuana use leads to more violence, the experience of medical cannabis states is a useful test.
Generally the paper finds no statistically significant effect one way or the other on violent crime or property crime. But if one fixates specifically on California, there does appear to be a significant reduction (a ~20% reduction) in both types of crime. I'm happy to call California an outlier and just declare this a null result. But the result is not favorable to the "cannabis use causes violence" story. See the comparison of synthetic controls versus actual experience in California.

By the way, if anyone is tempted to dismiss this as "some kid's term paper", note that Ben Hansen, got a similar result. Hansen is an academic economist with publications in the "synthetic controls" literature, notably this one, a working paper about the effects of cannabis legalization on auto fatalities. As far as I can tell he hasn't published on the violence question.
Reeform Madness generally finds that post-legalization violence rates in Colorado and Washington are slightly lower than the synthetic controls, and property crimes are slightly higher, but the results are not statistically significant. (Read the paper for the exact methodology; they're using some test statistics I'm not familiar with. Anyway, it's clear that they're not hitting the traditional "p < 0.05" threshold.)
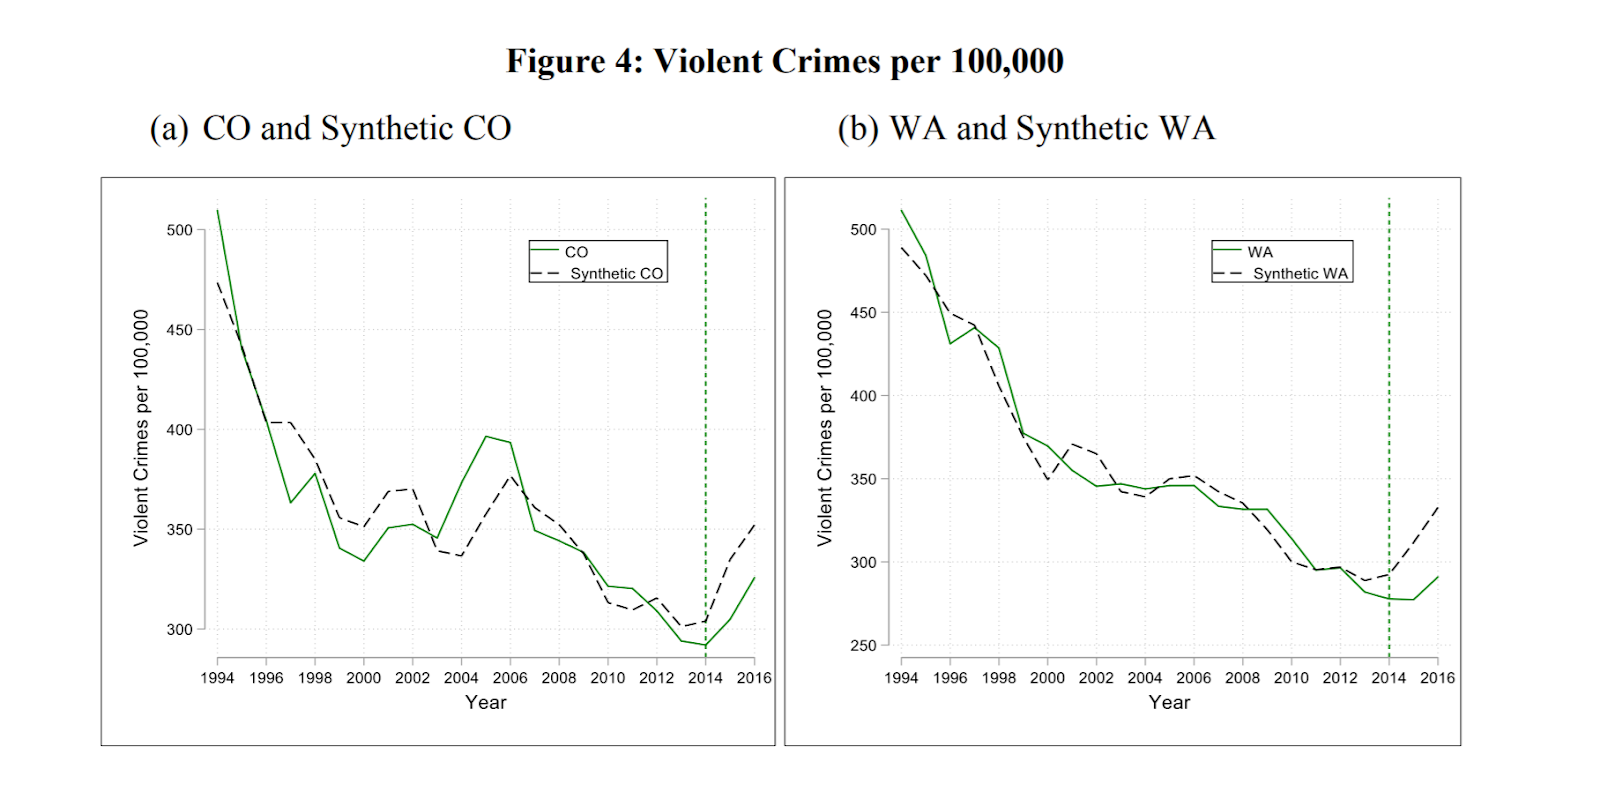


In sum, while it's true that Colorado and Washington saw increases in violent crime post legalization, states that look like Colorado and Washington saw comparable increases. I'm quite happy to call this a null result or declare it inconclusive. But certainly this doesn't paint a picture of a post-legalization spike in violence, even for those states that definitely did see increases in murder and assault.
Back-of-the-Envelope Sanity Check
I want to do a quick computation just to get an idea of what magnitude of effect Berenson is suggesting. Past-month cannabis use in Colorado was 10.4% of the population in 2011/2012 and 16.4% in 2016/2017. Let's subtract the two and say that 6% of the population turned from non-smokers to smokers because of legalization. The murder rate increased from 3.0 per 100k in 2011 to 3.4 per 100k in 2016, a 13% increase. For 6% of the population to drive a 13% increase in murder at the population level, this must mean that "past month cannabis use" is a huge risk factor for murder. It apparently increases your chance of becoming a murderer by 216% ( = 13% / 6% )! Even making some more conservative adjustments, this is a huge effect. Suppose that in addition to creating new users, legalization doubled the intensity of use among exiting users. So let's say effectively 16.4% of the population are "new users", adding the actual new users to the existing users who are now doing double-duty. And suppose we only blame pot legalization for half the increase in the murder rate (so call it 6.5% instead of 13%). We're still saying 16.4% of the population caused a 6.5% increase in the murder rate, so this population's murder rate must have increased by 40%. These seem like implausibly large figures to me. The people who are attributing even small population-level increased in violence to cannabis legalization are actually positing a huge effect of marijuana's propensity to cause violence. Of course, most of them will say, "No, no, you won't be 40% more likely to commit murder, or any more likely for that matter. It's all due to a small subset of people who can't handle it, have a bad reaction, and turn psychotic." But the smaller we make the "susceptible" population, the larger the effect on violence we must posit.
There is nothing special about Colorado; I get similar absurdly large "effect sizes" when I look at Oregon and Washington, depending on the end-points. Of course, as implied by the discussion above, doing this exercise for some states would yield negative effects of legalization on crime.
I think that you can probably find news stories about people who smoked way too much, got overly excited or paranoid, and did violence to someone. I even think it's reasonable to say that cannabis use was the cause, in a but for sense, of some of those violent acts. (I'm reminded of an old post at Slate Star Codex in which Scott Alexander describes a colleague's frustration with marijuana. It seems that cannabis use interfered badly with his treatment of some of his schizophrenia patients. This is part of Berenson's story: cannabis use is particularly bad for people with preexisting mental illness, even if it's benign for most users.) But these are exceedingly rare. Maybe it's reasonable to trumpet these stories as a cautionary tale for people with risk factors, but blaming them for population-level increases in violent crime is just implausible. It's also inconsistent with the crime data from various states.
I hope that someone with more time and better resources than myself picks this up and expands upon this literature. I think there is a lot more work that can be done. A suggestion to the people who are doing this kind of work, it might be helpful if you showed the full details of your analysis, say in an R Markdown or a Jupiter notebook. That way you can really answer your critics and say, "Which step in the analysis do you disagree with? Run it yourself and see if the result changes." That way, when someone furrows their brow at charts like the ones copied above, there is no question as to how they were generated. Give the critics a chance to respond with specific criticisms, and give yourself a means to "shut them up" if they're just blowing smoke.
No comments:
Post a Comment